Search Our Database
How to analyze processes and resource usage in Linux Server
Introduction
top is a command-line utility in Linux used to display real-time system processes and resource usage, including CPU, memory, and task management. The top command is essential for system administrators to monitor and manage server processes and performance in real-time. It provides detailed insights into which processes are consuming the most system resources, helping troubleshoot performance issues. This tool is useful when needing to analyze active processes, identify resource bottlenecks, and manage overall server health.
Prerequisites
- SSH access to the Linux server
- Basic knowledge of Linux command-line interface
Step-to-step guide
Step 1: Access to your server
- Access your server via SSH.
Step 2: Display processes and resource usage
- Launch the dashboard by run top command to list the real-time system processes and resource usage.
top
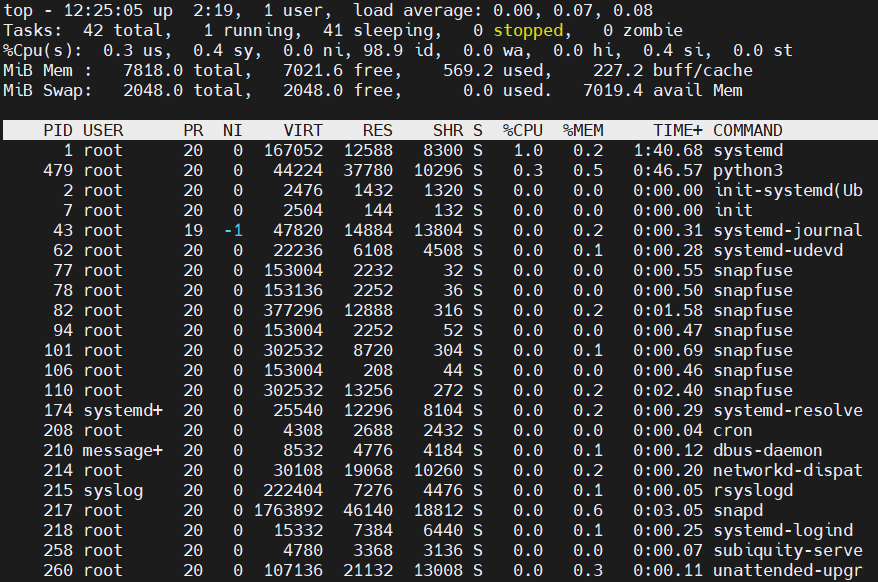
Breakdown:
System Uptime and Load Averages
* 12:25:05: The current system time.
* up 2:19: The system has been running for 2 hours and 19 minutes.
* 1 user: One user is logged into the system.
* load average: 0.00, 0.07, 0.08: The average system load over the last 1, 5, and 15 minutes, respectively. The load should not close to or more than your CPU core number. For example, if you are having 2 cores CPU the load should be lower than 1.5.Tasks
* 42 total: The system is currently running 42 tasks (processes).
* 1 running: One task is currently running and utilizing the CPU.
* 41 sleeping: 41 tasks are idle, waiting for events such as input or I/O operations.
* 0 stopped: No tasks are paused or stopped.
* 0 zombie: There are no zombie processes (defunct processes that have completed execution but remain in the process table).CPU Usage
* 0.3% us: Percentage of CPU used by user processes (normal programs).
* 0.4% sy: Percentage of CPU used by system processes (kernel operations).
* 0.0% ni: CPU usage by processes with manually adjusted nice values (no such processes currently).
* 98.9% id: CPU idle percentage (most of the CPU is idle).
* 0.0% wa: CPU time spent waiting for I/O operations (disk or network I/O).
* 0.0% hi: CPU time spent handling hardware interrupts.
* 0.4% si: CPU time spent handling software interrupts.
* 0.0% st: CPU time stolen by the hypervisor in a virtualized environment (not applicable here).Memory Usage
* 7818.0 MiB total: Total amount of physical memory (RAM) available in the system.
* 7021.6 MiB free: Free memory currently available.
* 569.2 MiB used: Memory currently being used by processes.
* 227.2 MiB buff/cache: Memory used by the system for buffers and cache, which can be reclaimed if needed.Swap Usage
* 2048.0 MiB total: Total swap space available.
* 2048.0 MiB free: All swap space is free, meaning no swap space is currently being used.
* 0.0 MiB used: No memory is swapped out to disk.
* 7019.4 MiB avail Mem]: Total available memory for processes, which includes free memory and cache memory that can be reclaimed if necessary.Process List
* PID: The process ID.
* USER: The user running the process.
* PR: Process priority (lower numbers indicate higher priority).
* NI: Nice value, which can affect process scheduling (lower values indicate higher priority).
* VIRT: Virtual memory size.
* RES: Resident memory size (physical memory being used).
* SHR: Shared memory size.
* S: Process state:
* R: Running.
* S: Sleeping (idle).
* Z: Zombie (defunct, completed process).
* %CPU: CPU usage percentage.
* %MEM: Memory usage percentage.
* TIME+: Total CPU time used by the process.
* COMMAND: Name of the command or process.
Step 3: Exit the dashboard
- Enter q to exit dashboard.
Conclusion
By going through this guidance, you will be able to monitor server processes and resource usage effectively using the top command.
For additional assistance or if you encounter any issues, please contact our support team at support@ipserverone.com.