Search Our Database
How to view server usage for Cloud Instances in Portal
Introduction
This guide explains how to view the server usage metrics for your cloud instances through the IPServerOne portal. By accessing these graphs, you can monitor key performance metrics such as CPU utilization, memory consumption, disk throughput, and bandwidth usage. This information is crucial for maintaining optimal performance and troubleshooting issues with your cloud instance.
Prerequisites
- Access to the IPServerOne portal.
- A cloud instance that you are actively managing.
Step-by-Step Guide
Step 1: Log in to the IPServerOne Portal
- Open your web browser and go to IPServerOne Portal.
- Enter your login credentials (email and password) and click Log In.
Step 2: Navigate to the Cloud Instance Section
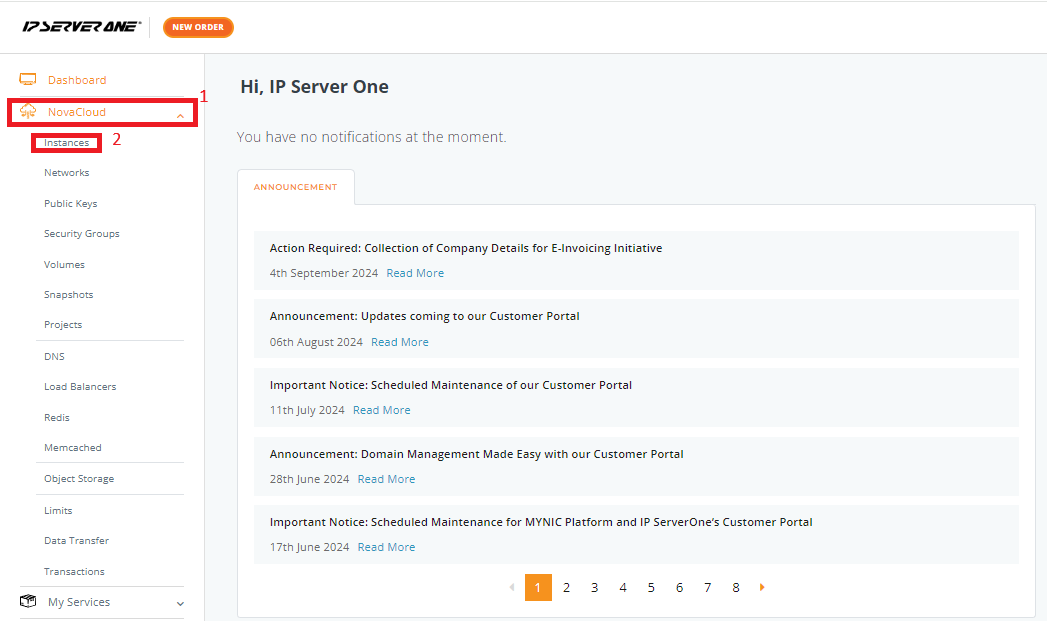
- Once logged in, navigate to the NovaCloud > Instances
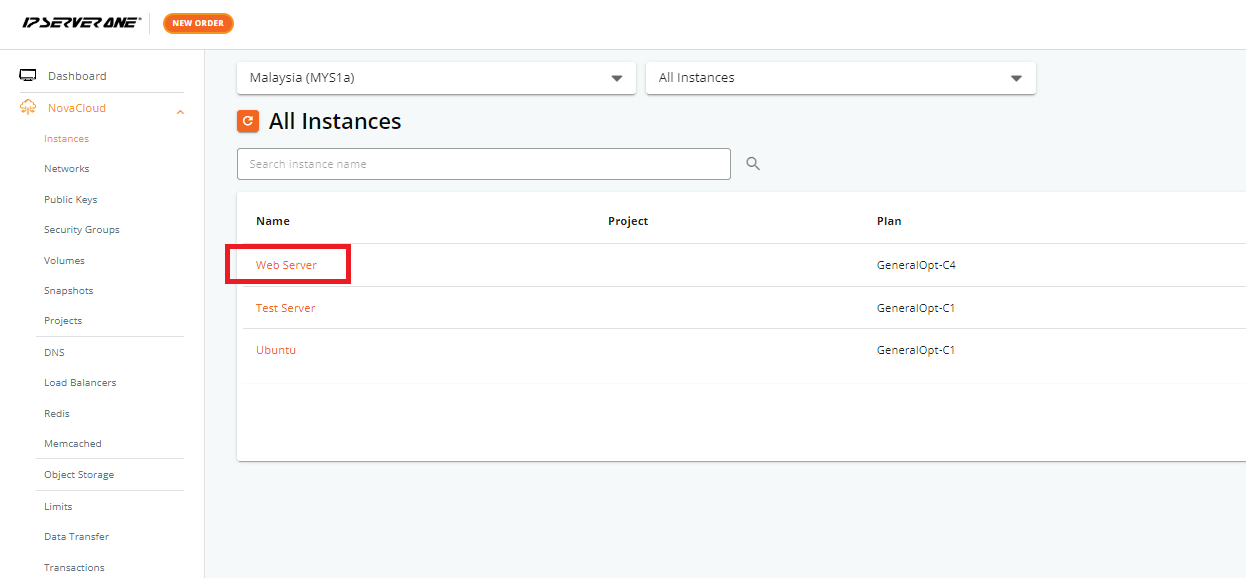
- Select the specific cloud instance for which you want to view the performance metrics.
Step 3: Access the Monitoring Tab
- Scroll down within the selected cloud instance’s overview page.
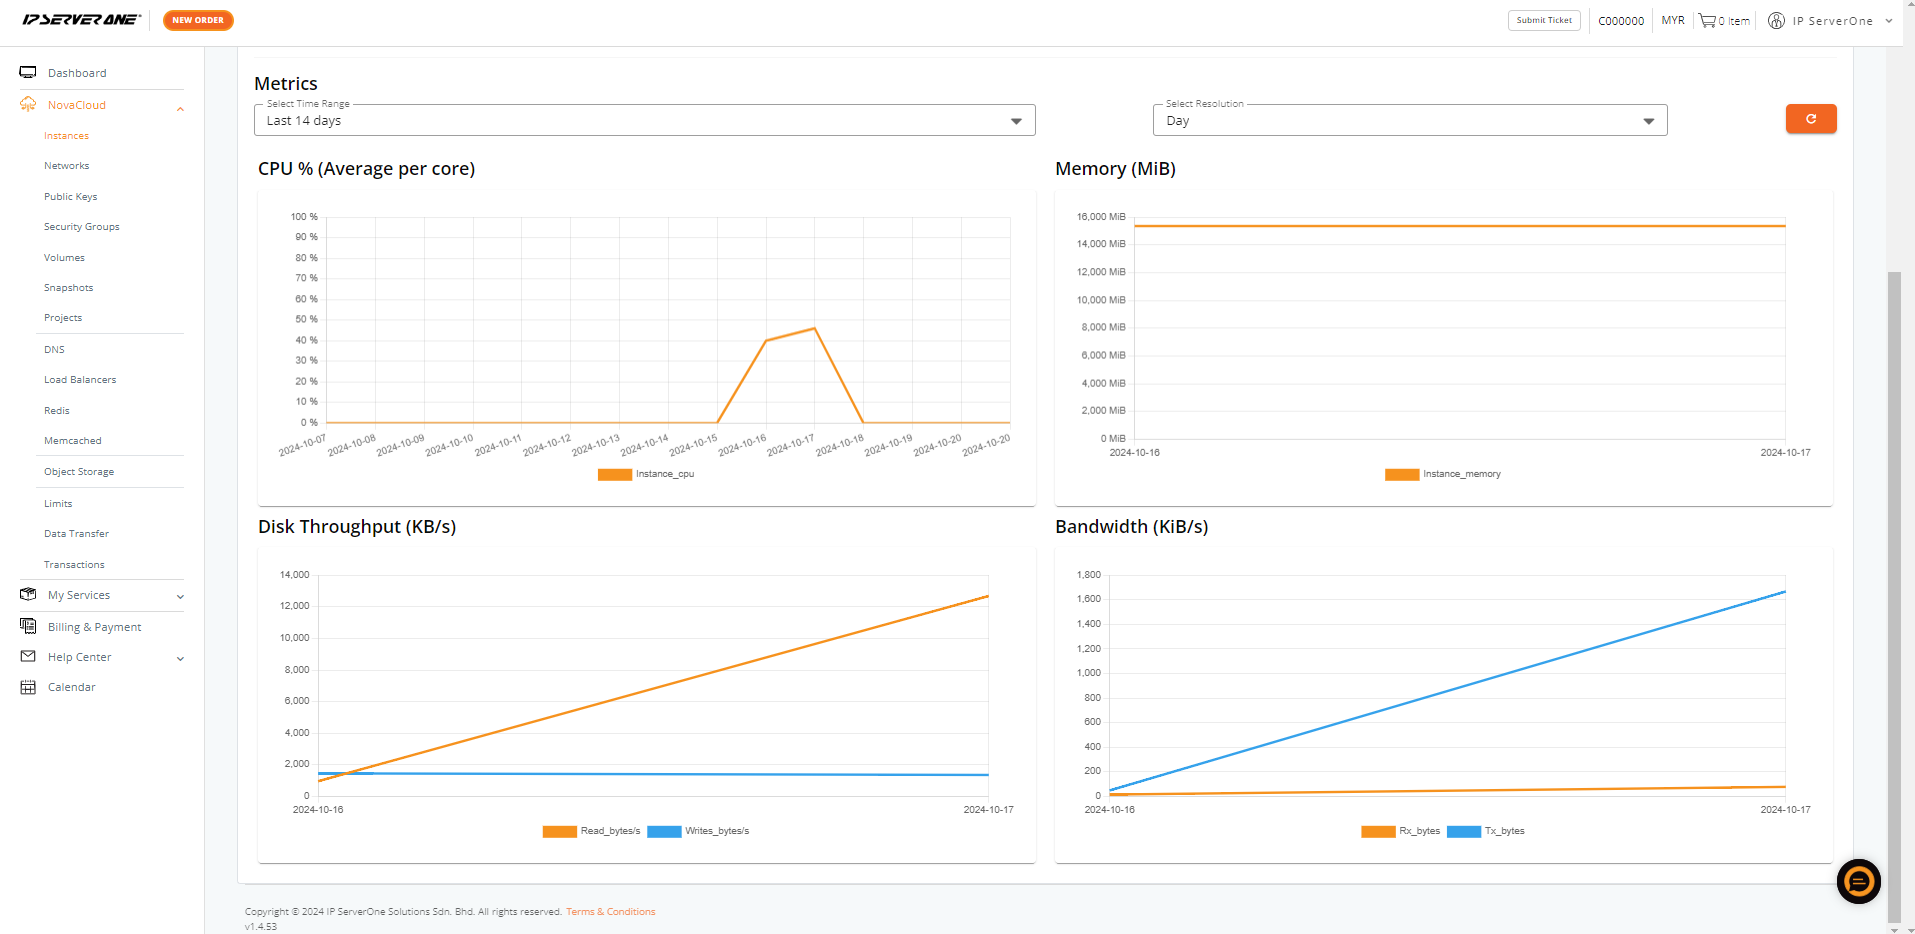
- This will display several performance graphs showing usage statistics such as CPU, memory, disk throughput, and bandwidth.
- You can adjust the time range of the displayed data by clicking on the Select Time Range dropdown menu
Step 4: Review the Performance Metrics
CPU % (Average per core)
- Description: This metric displays the average CPU utilization across all cores of the cloud instance.
- Graph Interpretation: Spikes or sustained high CPU usage may indicate that the instance is under heavy load or processing-intensive tasks.
Memory (MiB)
- Description: This graph shows the total memory consumption of the instance in megabytes (MiB).
- Graph Interpretation: A consistently high memory usage might indicate that the instance is running memory-intensive applications or processes.
Disk Throughput (KB/s)
- Description: This graph monitors the read and write operations on the disk, measured in kilobytes per second (KB/s).
- Graph Interpretation: High read or write throughput could suggest data-heavy applications such as database operations.
Bandwidth (KiB/s)
- Description: The bandwidth graph displays the incoming (Rx_bytes) and outgoing (Tx_bytes) network traffic in kibibytes per second (KiB/s).
- Graph Interpretation: Significant outgoing traffic may indicate data transfers or web hosting activity, while low incoming traffic suggests fewer data requests being made to the instance.
Step 5: Analyze the Data
- Use these graphs to identify trends and resource usage patterns. If a specific resource is overused, consider scaling your instance up or optimizing the running processes.
Conclusion
By regularly monitoring the CPU, memory, disk throughput, and bandwidth of your cloud instance, you can ensure the system runs efficiently and proactively address any performance issues. Adjust the time ranges as needed to get a more detailed view of the instance’s performance over various periods.
For additional assistance or if you encounter any issues, please contact our support team at support@ipserverone.com.


